Income Statement Explained Simply
The Income Statement is one of the three financial statements investors must understand to analyze businesses.
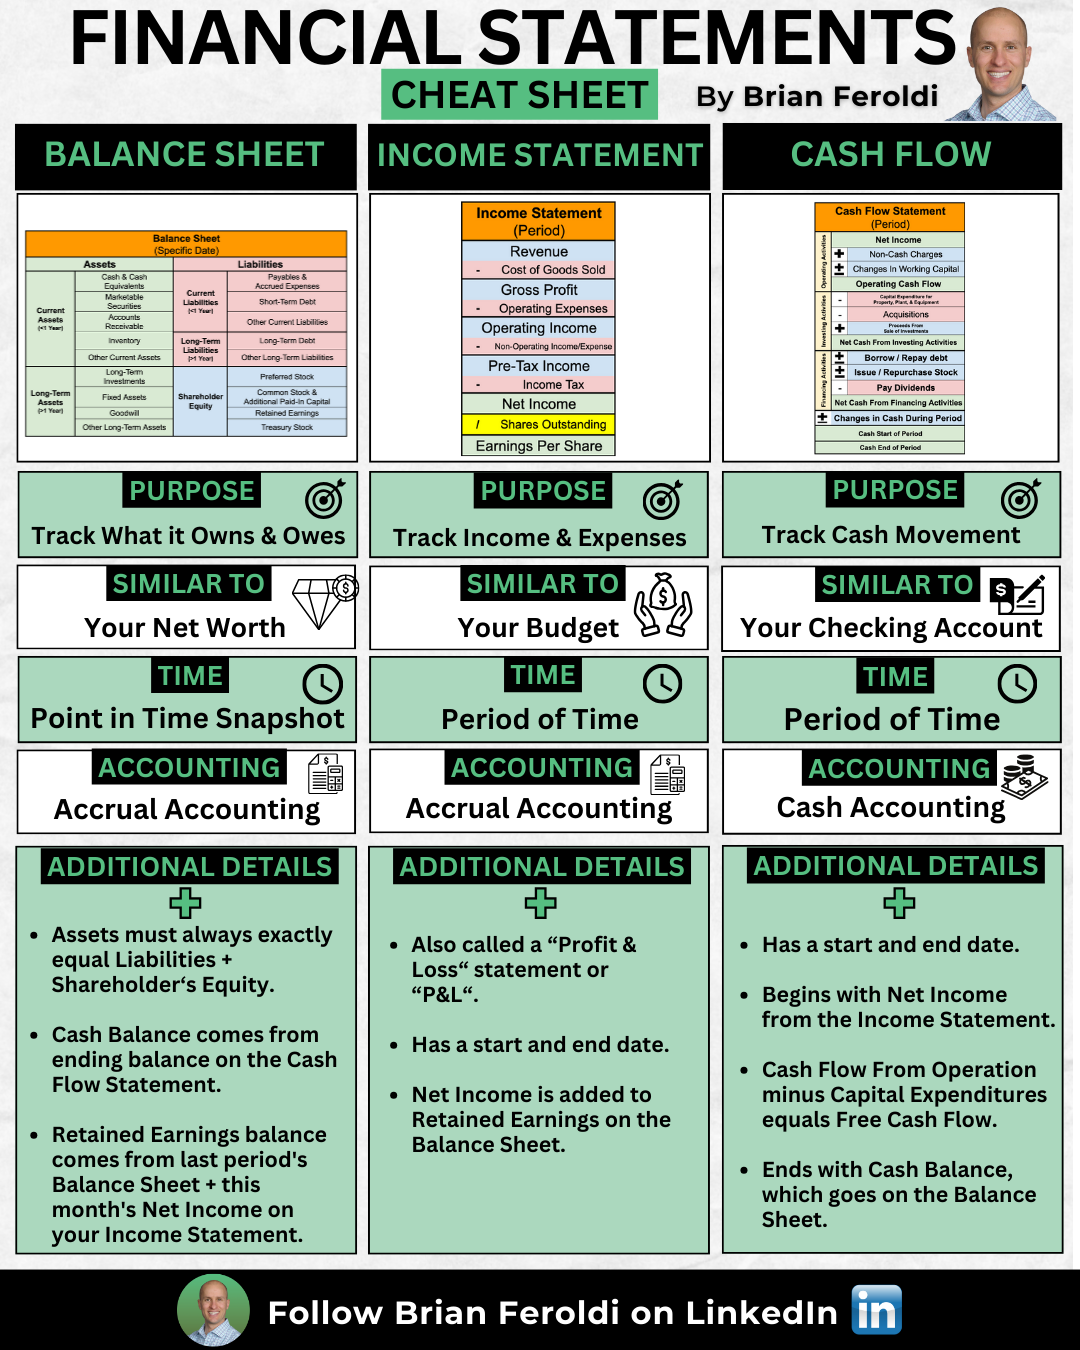
The purpose of the income statement is to show whether a company is profitable. It shows a company’s operating results over a period of time.
You can think of the income statement as you would your household budget.
If you were to look at your monthly budget, you would start by showing how much money you make from your job or other sources. Then, you’d subtract the expenses that you accrue during the month. The result? Your savings rate. With a company, the income statement follows a similar model.
Importantly, the income statement uses accrual accounting. This means revenue & expenses are recorded when a transaction occurs, regardless of whether a payment has been made.
It provides three crucial figures for investors:
- Revenue: Total sales
- Expenditures: Total costs and expenses
- Income: How much profit was generated
A company’s revenue, or sales, is all the money it makes by selling its products and services.
The company’s expenditures, such as supplier costs and employee salaries, are subtracted.
The result is a company’s profit (if a surplus amount is left over) or loss (if its expenses exceed its sales).
The income statement has a beginning and end date and usually measures a company’s quarter or year.
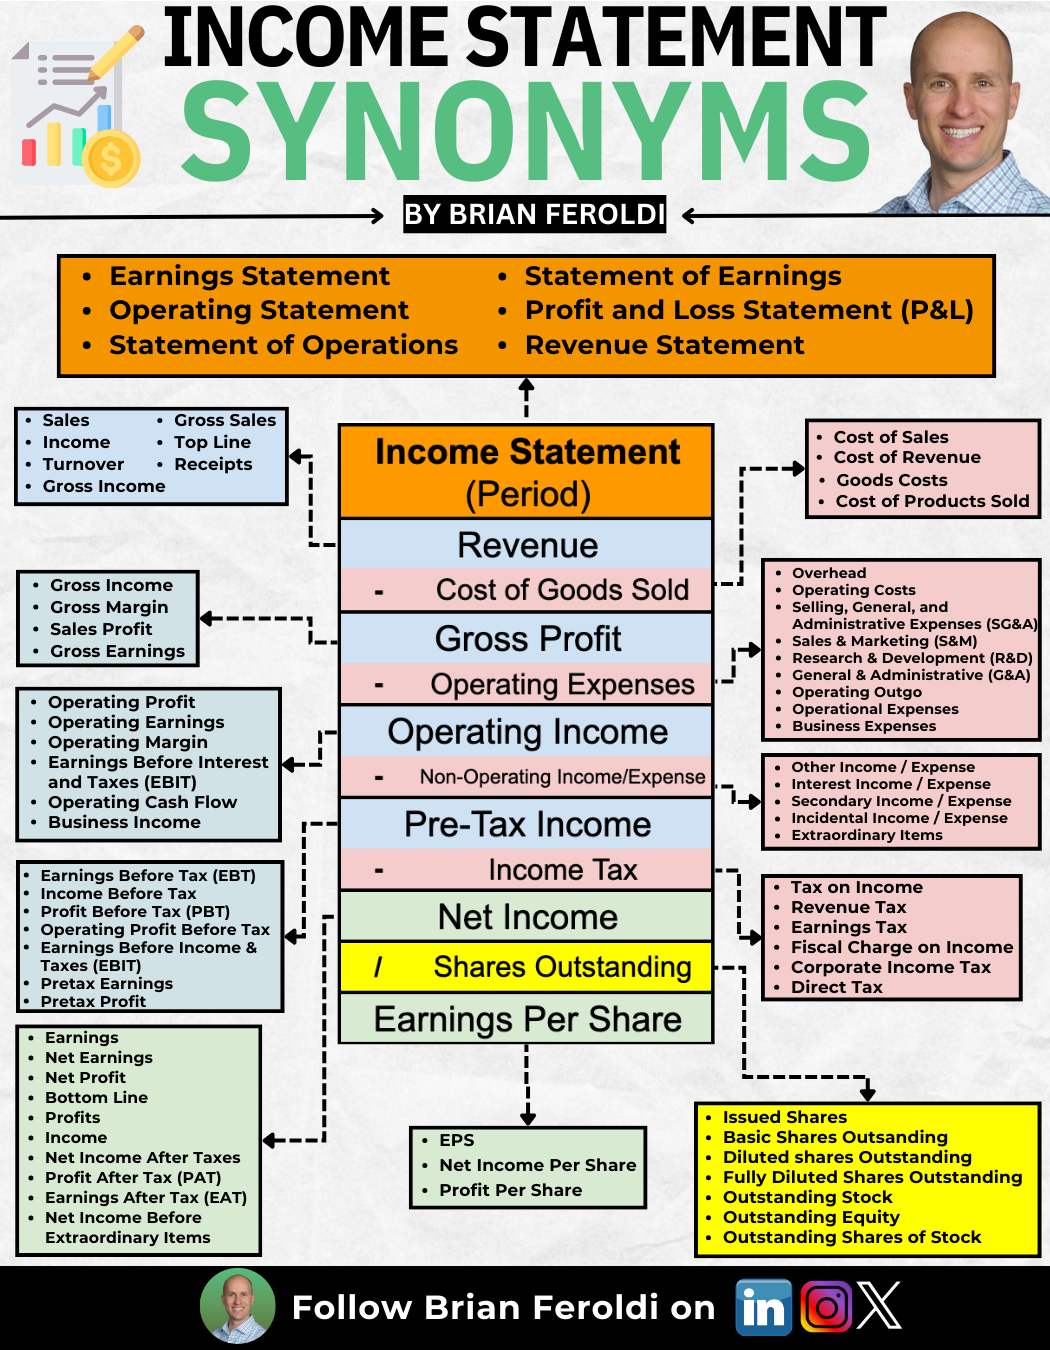
Here is a common layout for income statements, but individual companies might use variations.
Moving from top to bottom, let’s follow the money down the income statement to see how each of these figures is calculated:
Revenue – A company’s total sales after accounting for all discounts, rebates, and other paybacks.
For instance, if Domino’s Pizza sells a large pepperoni pizza for $12 but runs a special for the NFL opening weekend of 50% off, it only records $6 of revenue for each pepperoni pizza it sells during that special.
Cost of Goods Sold (COGS) – This is subtracted from the revenue and includes all expenses a company accrued to make its product or deliver its service. This includes raw materials, paying suppliers, employee costs, and equipment depreciation.
For our Domino’s Pizza example, COGS would include dough, cheese, and sauce costs.
Gross Profit – This is simply the result of subtracting COGS from revenue. Simply put, it is the total profits before operating expenses. This is one of the most important numbers on the income statement.
Operating Expenses – After gross profit, we subtract a company’s various operating expenses.
Operating expenses include everything a company spends on “overhead”. These expenses are often lumped together into common categories like sales and marketing (S&M), research and development (R&D), and selling, general, and administrative expenses (SG&A).
For our Domino’s Pizza example, operating expenses include spending on TV commercials and its corporate kitchen to develop new pizza recipes.
Operating Income – After subtracting operating expenses from gross profit, operating income is the result. This is the surplus that a company earns from running the business. This is another important number for investors to know.
Non-Operating Income/Expenses – This line item can include all the ways a company can earn & spend money not related to its core business.
On the income side, it could include interest it earns from cash it holds in its bank account.
On the expense side, it can include the interest it must pay on its debts.
Pre-Tax Income – Sometimes referred to as EBT (earnings before taxes), this is the company’s earnings before paying taxes.
Tax – Includes all the federal, state, and local taxes a company must pay.
Net Income – This represents a company’s total net income (also called “earnings” or “profits”) made during the period. However, public companies have one more step before reaching the ultimate bottom line.
Shares Outstanding – This is the total number of shares of a company. Each share has an equal claim on a company’s earnings.
Earnings Per Share (EPS) – Finally, we determine how much earnings each share has a claim on by dividing net income by outstanding shares.
While these are the most common categories you will see on an income statement, it’s important to know that management teams have full discretion over the layout & terms that they use.
This infographic shows many of the other terms you may find on an Income Statement.
In your search for great investments, the income statement can provide many clues beyond whether a company is profitable. It reveals whether a company uses a lot of debt to fuel growth or needs to spend a lot of money on R&D to maintain its competitive advantage.
Understanding these key terms and how each was reached will help you become a better investor
